

Translate this page into:
Early MR brain findings in a neonate with molybdenum cofactor deficiency
*Corresponding author: Hirva Manek, Department of Radiology, Bai Jerbai Wadia Hospital for Children, Mumbai, Maharashtra, India. hirvamanek@gmail.com
-
Received: ,
Accepted: ,
How to cite this article: Manek H, Gala F. Early MR brain findings in a neonate with molybdenum cofactor deficiency. Case Rep Clin Radiol. 2024;2:40-4. doi: 10.25259/CRCR_98_2023
Abstract
Molybdenum cofactor deficiency (MoCD) is an inborn error of metabolism which presents with neonatal encephalopathy, seizures, and a turbulent postnatal course. It is an under-recognized cause of neonatal encephalopathy as it mimics hypoxic ischemic encephalopathy (HIE) on imaging. We present the case of an affected male neonate of a twin pregnancy whose magnetic resonance imaging in the early neonatal period showed restricted diffusion in lobar distribution with areas of cystic gliosis and mild tortuosity of the intracranial vessels. There are only a few case reports to the best of our knowledge which describe magnetic resonance (MR) findings of MoCD on diffusion-weighted images, none of which mentions unilateral changes or vessel tortuosity. MoCD should be considered in children with MR findings mimicking HIE in the absence of a history of perinatal hypoxia. This is important as the disorder has a poorer prognosis and the parents need appropriate prenatal counseling.
Keywords
Magnetic resonance imaging
Brain
Neonate
Diffusion
Molybdenum

INTRODUCTION
Molybdenum cofactor deficiency (MoCD) is an autosomal recessive inborn error of sulfite metabolism causing neonatal encephalopathy, seizures, and metabolic acidosis. It mimics hypoxic ischemic brain injury on imaging but the absence of perinatal hypoxia and subtle differences in the imaging findings helps in distinguishing the two.[1] Subcortical cystic changes with ulegyria are described in the literature but imaging findings on diffusion-weighted images are not much discussed. We describe the diffusion-weighted magnetic resonance imaging (MRI) findings in male neonate of a twin pregnancy affected with MoCD and the simultaneous presence of acute and chronic changes of this metabolic abnormality.
CASE REPORT
A male child of a dichorionic diamniotic twin pregnancy was referred to our hospital for seizures which started on the day of life 2. The other child of the twins was unaffected. He was a full term baby born out of a third degree consanguineous marriage cried immediately after birth and his birth weight was 2.5 kg. There was a history of loss of a previous male child at the age of 2 years due to unknown reasons. The antenatal history of current pregnancy was unremarkable. The child was apparently normal on 1 day of life and accepted feed well. On day of life 2, he had right focal seizures and episodes of apnea which responded to stimuli. Seizure semiology was in the form of right upper limb clonic movements which occurred for 4–5 times a day and lasted for 30 s–1 min. On examination, the child had generalized hypotonia and brisk lower limb reflexes. His head circumference was 35 cm, normal. Mild facial dysmorphism was seen in form of baggy cheeks and bulbous nose. Blood investigations showed mildly elevated blood lactate (93.2 mmol/L) and ammonia levels (118 mcg/dL). Cerebrospinal fluid analysis showed mild increase in the total cell count (20 cells/mm3), raised proteins, and mildly elevated sugar suggesting an inflammatory pathology. His venous blood gas analysis, serum electrolytes, liver and renal function tests, inflammatory markers, and sepsis work up were unremarkable. MRI brain performed at day of life 14 showed restricted diffusion in subcortical white matter at the depths of the sulci in left cerebral hemisphere, in the splenium and genu of corpus callosum, left globus pallidum, and in corticospinal tracts in the pons. Diffuse abnormal T2 hyperintense white matter signal was seen in the left cerebral hemisphere and in the right frontal and high parietal lobes. Cystic encephalomalacia was seen in the left basal ganglia, posterior basifrontal lobe, and in the left insula. Gliosis with atrophy was also seen in the left basal ganglia and thalamus with left cerebral volume loss and dilated left lateral ventricle. There was lack of myelination in bilateral posterior limb of internal capsules (not shown). The abnormal diffuse T2 signal in the white matter showed T1 hypointensity. Gyriform T1 hyperintensity was seen along the cortex of the left cerebral hemisphere and in the periphery of the cystic gliosis in the deep gray nuclei [Figure 1a-f]. On magnetic resonance (MR) angiography, there was tortuosity of the intracranial vessels of the anterior and posterior circulation. The left middle cerebral artery showed good flow-related signal intensity ruling out perinatal vascular stroke. MR spectroscopy (MRS) showed a lactate doublet in the areas of restricted diffusion with its inversion on intermediate TE MRS [Figure 2]. Based on the heterogeneous temporal nature of the MR findings, lobar pattern of restricted diffusion, and absence of history of hypoxia, a possibility of underlying inborn error of metabolism (IEM) was raised. Genetic counseling was done and whole exome sequencing was performed. It revealed a homozygous mutation in Exon 2 of the MOSC2 gene suggesting MoCD type B.
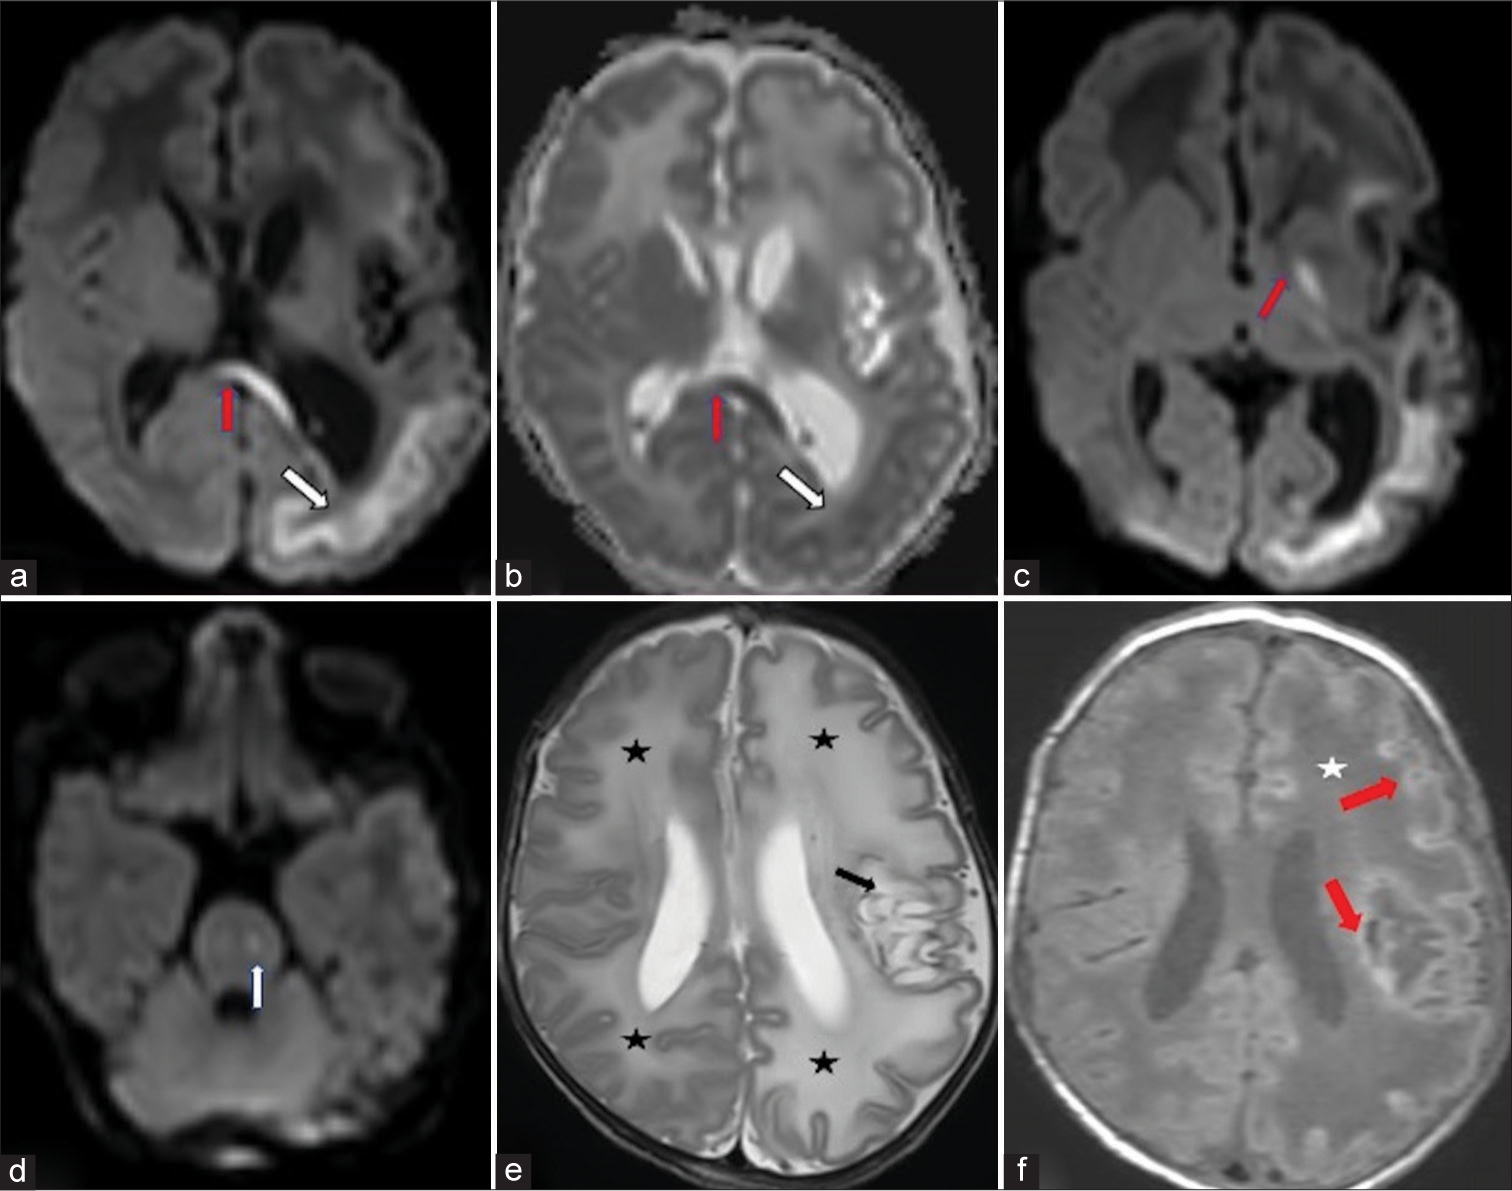
- Neonate with incessant seizures (a) Diffusion-weighted hyperintensity in lobar distribution the subcortical white matter along the depths of the sulci of the left cerebral hemisphere (white arrow) and in the genu of corpus callosum (red arrow). (b) Low apparent diffusion coefficient signal in the corresponding areas. (c) Restricted diffusion also in the left globus pallidum (red arrow). (d) Restricted diffusion in the left corticospinal tract at the level of pons (white arrow). (e) Axial T2-weighted images of the brain show diffuse hyperintense signal in bilateral cerebral white matter (left more than right) (black asterisk). Cystic gliosis in the peri insular white matter, left gangliocapsular region, and in the subinsular white matter (black arrow). (f) A axial T1-weighted image shows diffuse white matter hypointensity in the left cerebral hemisphere and right frontal lobe (star). Gyriform hyperintensity along the cortex with hyperintense rim along the cystic gliotic area in the left basal ganglia (red arrow).
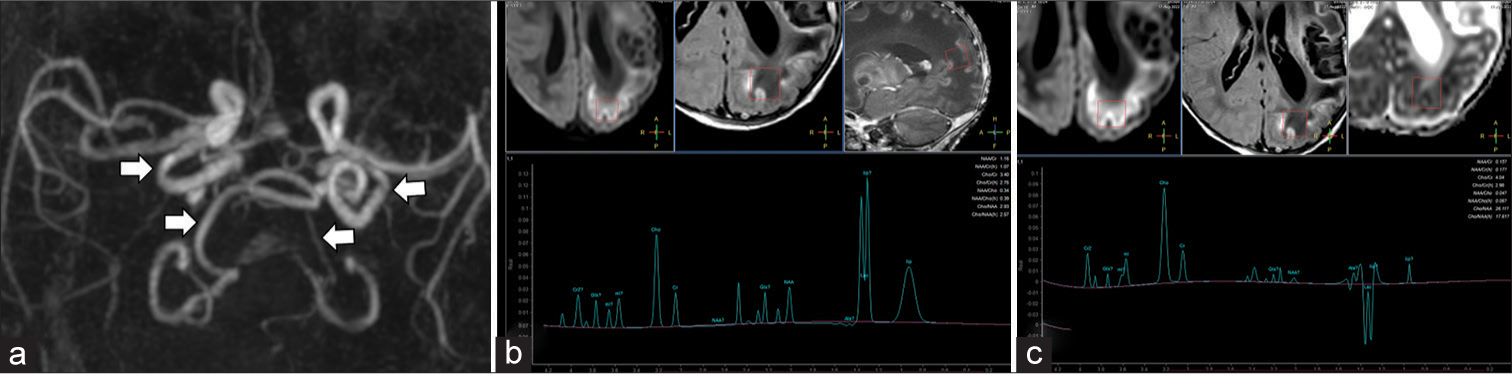
- Neonate with incessant seizures (a) 3D reformatted image of the magnetic resonance (MR) angiogram of intracranial vessels shows tortuosity of the intracranial vertebral and internal carotid arteries (white arrows). (b) MR spectroscopy (MRS) with region of interest in the left parietal lobe at short TE (35 ms) McRS shows reduced N-acetylaspartate (NAA) peak at 2.0 ppm and a large lactate doublet at 1.3 ppm. (c) The lactate doublet inverts on intermediate TE (144 ms) MRS.
DISCUSSION
Molybdenum cofactor synthesis is a multistep complex process involving a group of genes like MOSC1A and MOSC1B, MOSC2, MOSC3, and GPHN [Figure 3]. Ineffective metabolism of sulfites leads to their accumulation in tissue and increased urinary excretion of sulfites. Defective function of xanthine oxidase leads to low plasma urate levels and increased urinary excretion of xanthine and hypoxanthine.[1] Hence, urine analysis for these metabolites is suggestive of this underlying IEM in cases suspected of a metabolic abnormality.
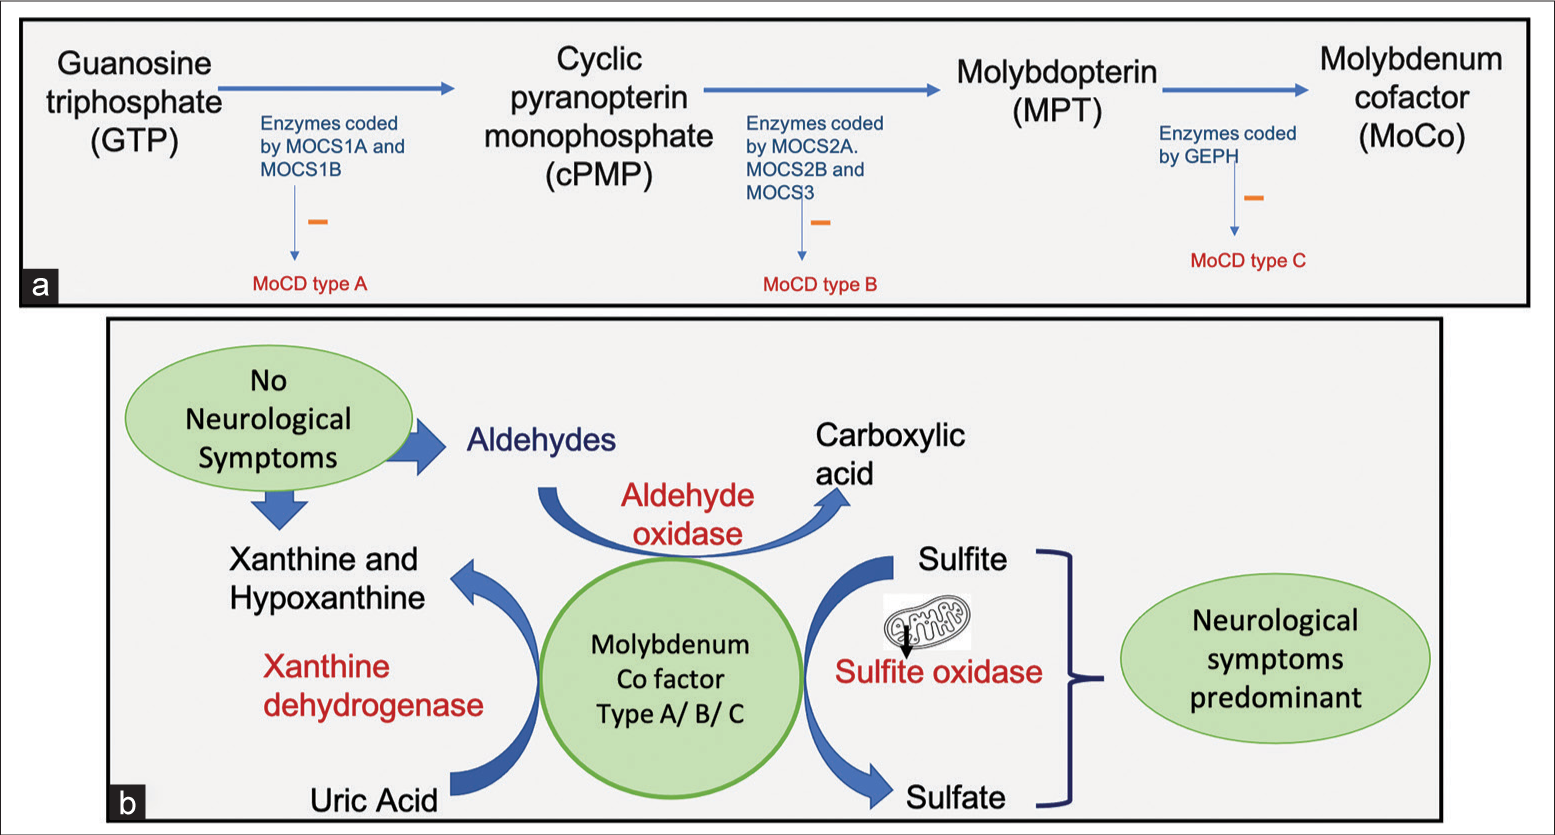
- (a) Schematic flow diagram of synthesis of molybdenum cofactor and the role of the Molybdenum cofactor synthesis genes (MOCS) genes in its synthesis. (b) Schematic diagram representing the role of various molybdenum cofactor enzymes in the metabolic pathways.
MoCD can have an early onset in the neonatal period or late onset in the childhood or adulthood. The early onset forms present with neonatal encephalopathy, seizures, facial dysmorphism, feeding difficulties, and dystonia. Late onset types have less severe phenotype and the acute neurological deterioration is precipitated by an infection. Some late presenting cases have visual impairment due to lens subluxation. The episodes in this subgroup are characterized by nystagmus, ataxia, dystonia, and altered mental status which might resolve after the treatment of the underlying infection or may progress over lifetime.[2]
MRI findings in MoCD include subcortical white matter cystic changes, ulegyria, basal ganglia cystic changes, and atrophy and thin corpus callosum with relative preservation of thalami.[3-5] Restricted diffusion along the corticospinal tracts and in lobar distribution along the depths of the sulci is also described in MOSC2 gene mutation.[4,6] Our case showed similar findings but with the simultaneous presence of unilateral basal ganglia and peri insular cystic changes and characteristic pattern of lobar restricted diffusion in the MR scan performed on day of life 14. These findings of acute areas of neurotoxicity showing restricted diffusion and chronic changes in the form of cystic encephalomalacia have been described just in one case report in a child with mutation in MOSC1 gene.[7] A T2 intermediate thin linear signal along the cortex is seen in some cases of early presenting MoCD as described in a case series by Vijayakumar et al. Involvement of the basal ganglia structures was also seen in this study but in a symmetric fashion. We did not see a similar pattern of findings in our case.[8] The angiogram finding of mildly tortuous intracranial vessels which was seen in our case is not described. The areas of subtle restricted diffusion in the genu and splenium of corpus callosum can be thought to be a prequel of the corpus callosum thinning described in children with this IEM. One of the limitations in our case was that the urine analysis for sulfites and xanthine metabolites was not performed.
Isolated sulfite oxidase deficiency is very similar to MoCD on imaging and clinical presentation. Urine analysis for metabolites helps in differentiating between the two as hypoxanthine and xanthine are not elevated in ISO deficiency.[1]
The other differential in our case is Menke Kinky hair syndrome due to diffuse white matter abnormality, multifocal areas of cystic gliosis, basal ganglia involvement, and vessel tortuosity. However, the child did not have classical fragile sparse scalp hair and his serum copper levels turned out to be normal.[9,10]
Hypoxic ischemic encephalopathy (HIE) which is a common and a close differential of MoCD was not considered as there was no history of perinatal hypoxia and the distribution of the injury on MR brain did not confirm to those seen in HIE. Children with a history of prolonged mild-to-moderate HIE at birth can show multicystic encephalomalacia in periventricular and subcortical distribution with ulegyria as its sequalae. However, these changes are usually symmetric and temporally uniform unlike those in MoCD as in our case. In HIE, there is uniform progression of the involved areas from cytotoxic edema to cystic encephalomalacia, cerebral volume loss with ex vaccuo ventricular dilatation. The distribution and extent of involvement in children with perinatal hypoxia are also characteristic based on the severity and the duration of the insult.[11]
In summary, knowledge of the acute and chronic brain changes of MoCD on MRI, birth history, clinical features of dysmorphism, and urine analysis help in differentiating these seemingly similar appearing pathologies on imaging.
CONCLUSION
Molybdenum cofactor deficiency syndrome is an important cause of neonatal encephalopathy. It can sometimes mimic HIE and other metabolic abnormalities, but its appropriate diagnosis is important for parents and their prenatal counseling. Since MRI is the investigation performed in patients with neonatal encephalopathy, it is important to be aware of the imaging findings of this IEM in its acute and chronic stages. This helps in prompting appropriate investigations such as urine sulfites and plasma urate for screening and genetic analysis for eventual confirmation of this metabolic abnormality.
TEACHING POINTS
Inborn errors of metabolism (IEM) are an important cause of neonatal encephalopathy and MR imaging can play a significant role in their diagnosis.
Some IEM like molybdenum cofactor deficiency or isolated sulfite oxidase deficiency can mimic perinatal stroke or hypoxic insult and knowing minor differences in their imaging presentation can help in differentiating them.
Correlation with laboratory findings and clinical presentation is a must when approaching a case of neonatal encephalopathy.
MoCD has temporally heterogeneous presentation with lack of symmetry of the findings on imaging unlike HIE.
MCQs
-
Following can be seen on MRI in a neonate with MoCD:
Subcortical cystic gliosis
Polymicrogyria
Restricted diffusion at the depths of sulci
Both A and C
Answer Key: d
-
MoCD and isolated sulfite oxidase deficiency can be differentiated by:
MRI
Urine metabolites
Age at presentation
Clinical findings
Answer Key: b
-
All of the following are true for late presenting cases of MoCD except
They have global developmental delay
Episodes of neurological deterioration are precipitated by an intercurrent illness
May have visual impairment due to lens subluxation
Have classical facial dysmorphism with sparse and thin fragile hair
Answer Key: d
Ethical approval
The study was approved by the Ethical Review Committee of our Institute.
Declaration of patient consent
Patient’s consent not required as patients identity is not disclosed or compromised.
Conflicts of interest
There are no conflicts of interest.
Use of artificial intelligence (AI)-assisted technology for manuscript preparation
The authors confirm that there was no use of artificial intelligence (AI)-assisted technology for assisting in the writing or editing of the manuscript and no images were manipulated using AI.
Financial support and sponsorship
Nil.
References
- Molybdenum cofactor deficiency (MoCD): A rare genetic disorder in newborns. Neurol Rev. 2021;7:7.
- [Google Scholar]
- Delineating the phenotypic spectrum of sulfite oxidase and molybdenum cofactor deficiency. Neurol Genet. 2020;6:e486.
- [CrossRef] [PubMed] [Google Scholar]
- A neonate with molybdenum cofactor deficiency Type B. Transl Pediatr. 2021;10:1039-44.
- [CrossRef] [PubMed] [Google Scholar]
- Novel imaging finding and novel mutation in an infant with molybdenum cofactor deficiency, a mimicker of hypoxic-ischaemic encephalopathy. Iran J Child Neurol. 2018;12:107-12.
- [Google Scholar]
- Molybdenum cofactor deficiency: Neuroimaging findings. Radiol Case Rep. 2018;13:592-5.
- [CrossRef] [PubMed] [Google Scholar]
- Distinctive pattern of restricted diffusion in a neonate with molybdenum cofactor deficiency. Pediatr Radiol. 2013;43:882-5.
- [CrossRef] [PubMed] [Google Scholar]
- Early features in neuroimaging of two siblings with molybdenum cofactor deficiency. Pediatrics. 2014;133:e267-71.
- [CrossRef] [PubMed] [Google Scholar]
- Clinical neuroimaging features and outcome in molybdenum cofactor deficiency. Pediatr Neurol. 2011;45:246-52.
- [CrossRef] [PubMed] [Google Scholar]
- Neuroimaging in menkes disease. J Pediatr Neurosci. 2017;12:378-82.
- [CrossRef] [PubMed] [Google Scholar]
- Neuroimaging changes in menkes disease, Part 2. AJNR Am J Neuroradiol. 2017;38:1858-65.
- [CrossRef] [PubMed] [Google Scholar]
- Magnetic resonance imaging spectrum of perinatal hypoxicischemic brain injury. Indian J Radiol Imaging. 2016;26:316-27. Erratum in: Indian J Radiol Imaging 2016;26:530
- [CrossRef] [PubMed] [Google Scholar]


