

Translate this page into:
Late-onset Krabbe disease: Spectrum of radiological findings

*Corresponding author: Merter Keçeli, Department of Pediatric Radiology, Ankara City Hospital, Ankara, Turkey. merterkeceli@gmail.com
-
Received: ,
Accepted: ,
How to cite this article: Keçeli M, Süngü H. Late-onset Krabbe disease: Spectrum of radiological findings. Case Rep Clin Radiol. doi: 10.25259/CRCR_34_2025
Abstract
Krabbe disease (KD) is a lysosomal disease caused by an enzyme defect that causes galactocerebrosidase to accumulate in tissue. It causes radiological findings in the leukodystrophy pattern. This article aims to interpret the most common and rare radiological findings. Magnetic resonance imaging and computed tomography examinations revealed corticospinal tract, periventricular white matter, corpus callosum and dentate nucleus involvement, and cerebral calcification in four children with late-onset KD. The most common finding is pathological signal in the corticospinal system; the rarest finding is calcification.
Keywords
Calcification
Corticospinal tractus
Krabbe disease
Leukodystrophy
Magnetic resonance imaging

INTRODUCTION
Krabbe disease (KD), a rare leukodystrophy often overlooked in routine radiology, is an autosomal recessive lysosomal disorder resulting from a deficiency in the enzyme beta-galactocerebrosidase (GALC).[1] KD is caused by mutations in the GALC gene, which encodes the enzyme GALC and is responsible for breaking down galactosylceramide, a normal component of myelin. Galactosylceramide, which accumulates within the cell, adversely affects the brain’s white matter and disrupts myelin production. Since pathological myelin can be visualized radiologically, knowledge of the imaging findings in this group of diseases is necessary to reach a diagnosis.[1,2]
This article discusses the different radiological patterns in late-onset KD. Radiological examinations were performed with 1.5 Tesla, 16-channel magnetic resonance imaging (MRI) scanner, and 64-slice computed tomography (CT).
In this case series, all patients were diagnosed with KD based on the results of leukocyte enzymatic activity and genetic mutation analysis. In preparing this article, consent was obtained from the parents of the cases whose radiological images were used.
CASE SERIES
Case 1 and Case 2
Nine-year-old girl presented with grip weakness and tremors in her right hand, which began 2 weeks ago and have persisted.
CT revealed calcifications in the parieto-occipital periventricular white matter and rolandic sulcus (RS) cortex. There was a decrease in white matter volume and cortical atrophy [Figure 1a-e]. MRI revealed symmetric hyperintensities extending from bilateral parietal-occipital periventricular white matter to the splenium of the corpus callosum on T2-weighted (T2W) and T2 fluid-attenuated ınversion recovery (FLAIR) sequences. Asymmetrical high signals were observed in bilateral corticospinal tracts (CSTs) and dentate nuclei [Figure 1f-j]. There was contrast enhancement in the RS [Figure 1k and l]. On diffusion-weighted images, there was a restriction in the area extending from the RS to the thalamus and also in the posterior periventricular region [Figure 1m-p].
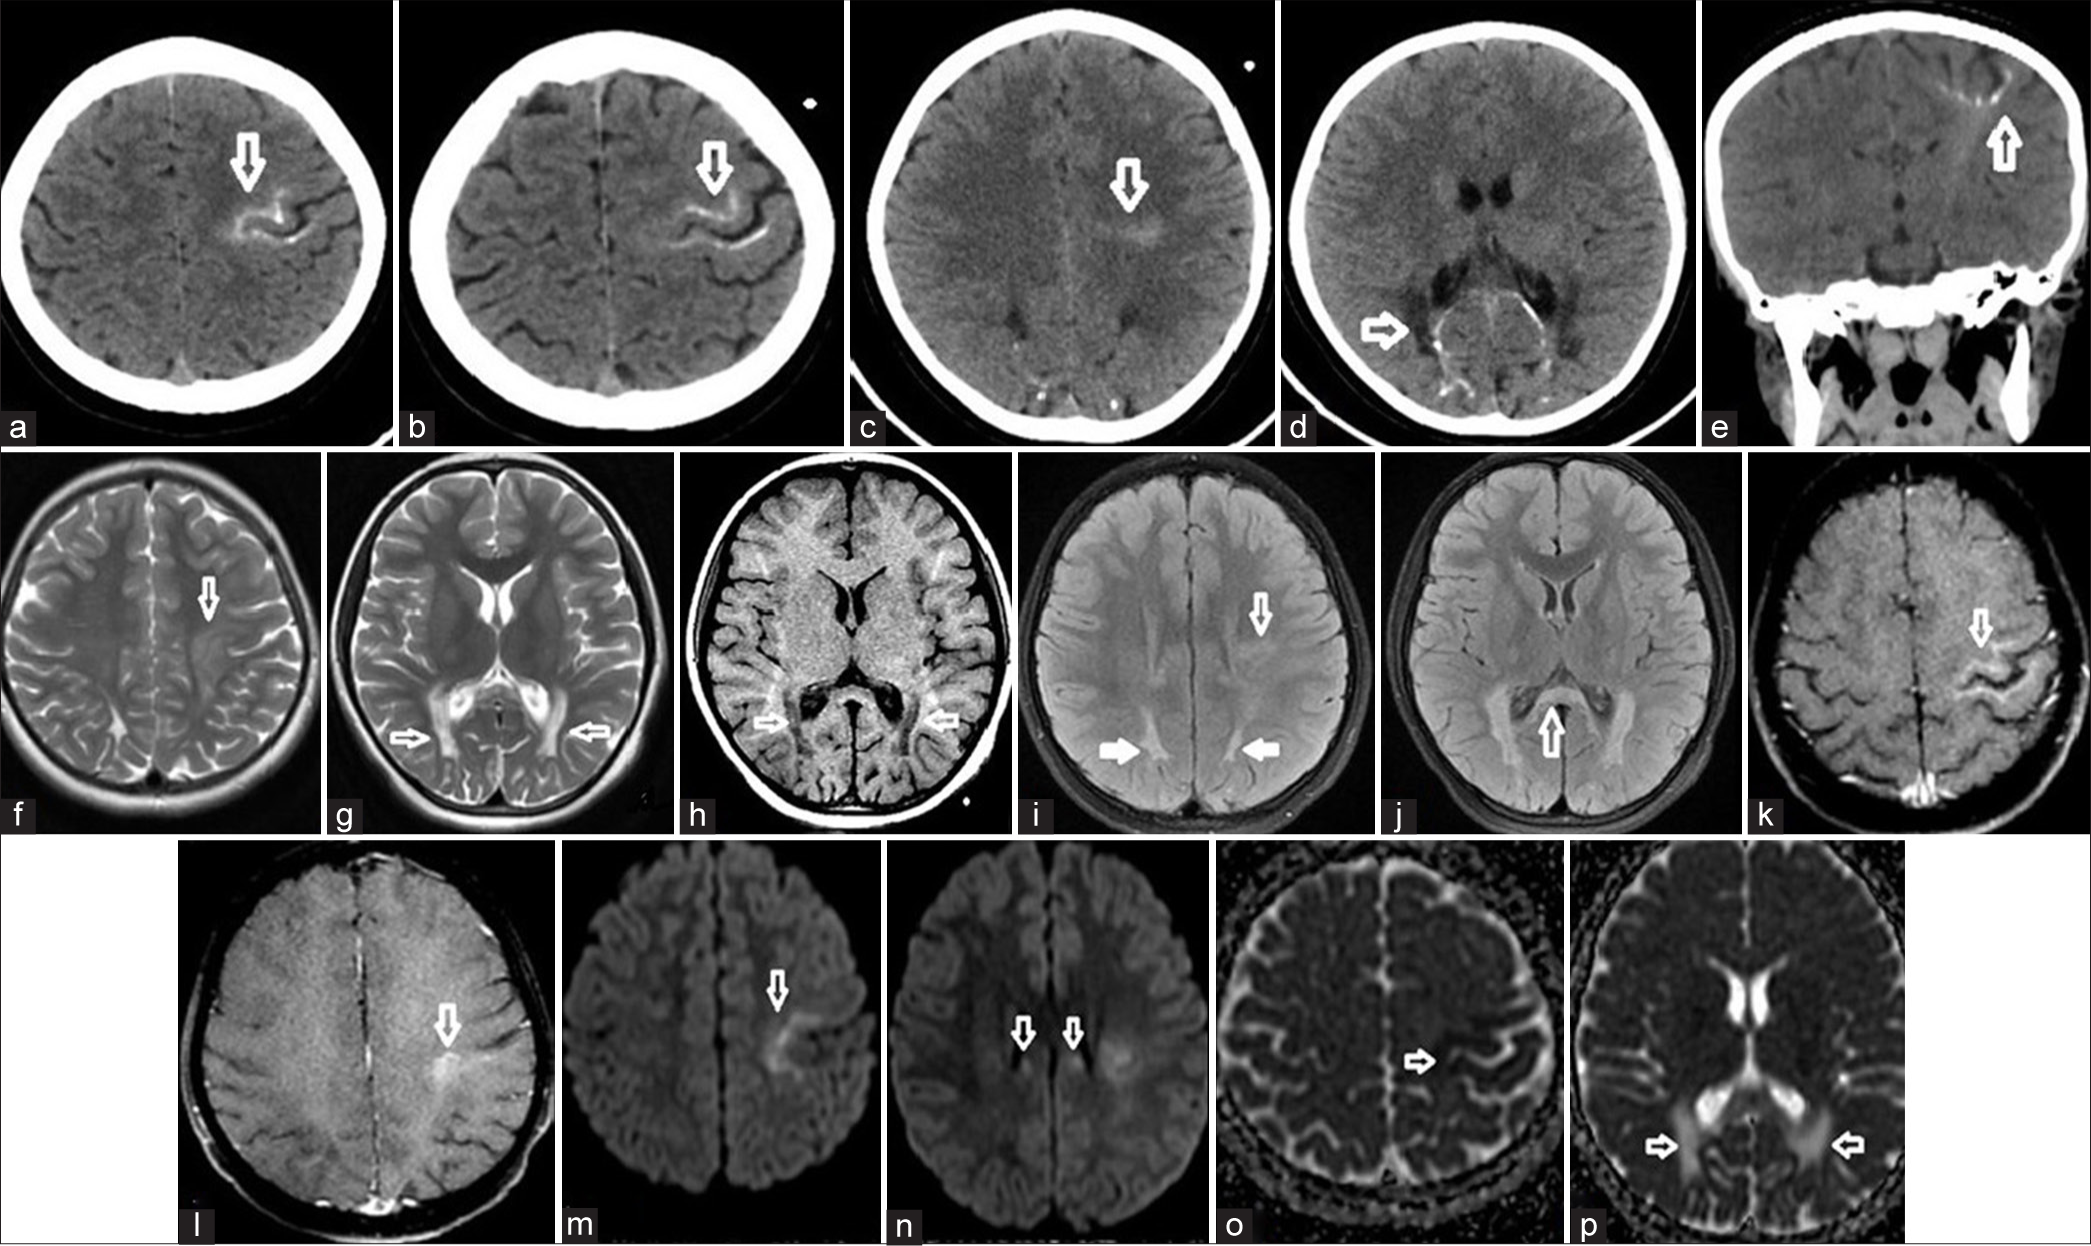
- (a-e) In cranial computed tomography, cerebral cortical-subcortical linear calcification was detected in the Rolandic cortex. There was a similar appearance in both occipital periventricular white matter (white arrows). (f-h) In magnetic resonance imaging, high signal areas were detected in the same regions on T2-weighted images and low signal areas were detected on T1-weighted images (white arrows). (i-j) In T2 Fluid-attenuated inversion recovery images, in addition to these areas, high signal areas are observed in the corticospinal tracts in the brainstem and corpus callosum and the splenium (white arrows). (k-l) Moderate contrast enhancement was detected in the Rolandic cortex (white arrows). (m-o) Diffusion-weighted images and apparent diffusion coefficient map revealed diffusion restriction at the vertical level (white arrows). (p) In addition, diffusion facilitation due to high T2 signal is seen in the apparent diffusion coefficient maps in both occipital periventricular areas (white arrows).
Single voxel MR spectroscopy (MRS) obtained from parietal white matter N-Acetylaspartic acid to creatine ratios were low, and Cho/Cr ratio was high, consistent with neuronal loss. There was no lactate/lipid peak.
Her 4-year-old brother, who had no complaints or neurological findings, was also evaluated. No pathological findings were found in the MRI of the boy diagnosed with KD.
Case 3
A 10-year-old boy complained of tremors in his left hand and decreased left-hand muscle strength for the past 2 months.
There was only moderate atrophy on CT. In contrast-enhanced MRI, high signal intensities extending from the RS along the CST through the internal capsule to the brainstem, high signal foci in the periventricular white matter concentrated in the parietal-occipital areas, and decreased white matter volume were detected in T2W and T2 FLAIR sequences [Figure 2]. Subcortical U fibers were preserved. A peripheral hyperintense and central hypointense appearance, called the sandwich appearance, was observed in the dentate nuclei [Figure 2c].[3] The optic chiasm and both optic nerves were observed to be thick [Figure 2f]. There was no pathological contrast enhancement.

- (a and b) In addition to cerebral atrophy, hyperintensities were observed in the periventricular white matter, mesencephalon, and corticospinal tracts on T2-weighted images (white arrows). (c) The sandwich appearances consisting of hypointensities and hyperintensities were observed in both dentate nuclei (white arrows). (d and e) There was no diffusional change in diffusion weighted images and apparent diffusion coefficient map. (f) Thickening of the optic nerves was observed on the T2 fluid-attenuated ınversion recovery image (white arrow).
The CST and periventricular white matter involvement, optic nerve thickening, and sandwich appearance in the dentate nuclei identified on MRI were reported to be compatible with KD [Figure 2d].
Case 4
A 12-year-old male patient presented with complaints of decreased academic performance and left arm tremors for the past 2 months. In contrast-enhanced MR imaging, hyperintense signals were seen in T2W and T2 FLAIR sequences following the CST from the bilateral RS to the brainstem [Figure 3a-d]. There were no atrophy and diffusion restriction [Figure 3e-f]. Deep gray matter, cortical structures, and cranial nerves were normal. The findings described were consistent with KD.

- (a-d) In both corticospinal tracts, hyperintensities were seen on axial and coronal plans T2-weighted and axial plane T2 fluid-attenuated ınversion recovery images (white arrows). (e and f) A moderately high signal was observed in both tracts on diffusion-weighted images and there was no significant signal change on the apparent diffusion coefficient map (white arrow). There is no restriction of diffusion along the tract.
DISCUSSION
MRI plays a crucial role in diagnosing and differentiating leukodystrophies due to the characteristic patterns they produce. It can detect nerve involvement and signals resulting from damage to myelinated neurons.[1,4-7] This case series aims to highlight findings across various radiological presentations of KD.
In late-onset KD, the main symptoms include muscle weakness or stiffness, difficulty walking, hearing or vision loss, epileptic seizures, and decreased mental ability.[1]
In KD, hyperdensities occur in the thalamus, periventricular white matter, and corona radiata on CT as a result of the accumulation of galactosylceramide in the cells.[6-9]
In MRI, hyperintense signal develops in T2W images due to myelin damage in the CST, internal capsules, and deep cerebral white matter. Subcortical U fibers are spared. Non-specifically, MRS shows a decrease in NAA consistent with neuronal loss. It shows increased concentrations of myoinositol, Cho, Cr, and lactate in affected areas.[5,6]
Diffusion tensor imaging may be useful in the diagnosis of KD by demonstrating decreased fractional anisotropy values in the CST.[6,7]
Symmetrical thickening exceeding 4 mm in the prechiasmatic segment of the optic nerves is an important finding.[3,4,7]
In recent years, cerebral calcification has been described in publications reporting KD, leading to diagnostic confusion.[8-10] Livingston et al. identified brain white matter calcification with MRI and CT in three pediatric cases with early-onset KD.[9] Lehman et al., reported basal ganglia and white matter calcifications in a 6-month-old boy with KD.[10] The development of dystrophic calcification in areas with high globoid cell concentration is remarkable. This finding was detected in one case in our series.
Muthusamy et al., four patterns of white matter involvement were defined according to the age at which clinical findings appear: First, the infantile pattern presented with involvement of the periventricular white matter, posterior limb of the internal capsule and CST, brainstem and deep cerebellar nuclei, and dentate nucleus hilum. A tigroid pattern in supratentorial region and trilaminar tram-trackmay pattern in posterior limb of internal capsule may be seen. Second, juvenile/adult pattern is the involvement defined in the posterior periventicular region, deep white matter, and corpus callosum splenium. Third pattern is isolated CST involvement with corpus callosum and cerebral atrophy. The fourth pattern is widespread deep white matter involvement in frontal and posterior distribution without CST and cerebellar involvement.[7] In addition, subdural collections have been identified. Calcification has not been reported.
Radiological differential diagnoses include metachromatic leukodystrophy, GM1 and GM2 gangliosidosis, Canavan disease, X-linked adrenoleukodystrophy, Pelizaeus– Merzbacher disease, and Alexander disease.[7,8,10]
The most frequently MRI in the four children with KD diagnosis was hyperintensities on T2W and T2 FLAIR along the CST extending from the RS to the brainstem. When these findings are identified, KD should be suspected in the minds of the physicians. Cerebral calcification is a rare finding [Table 1].
| Findings in CT | Findings in MRI |
|---|---|
| Patient 1 | |
| • Calcifications in the left parieto-occipital periventricular white matter and cortex • Hypodensities and calcifications in the white matter at the level of the Rolandic sulcus • Atrophy |
• Diffusion restriction in left frontal cortex, extending from the precentral and postcentral gyrus levels to the thalamus-posterior periventricular region • On T2W and T2 FLAIR sequences, symmetrical hyperintensities extending from bilateral parietal and occipital periventricular white matter to the corpus callosum splenium. • Asymmetrical high signals in bilateral corticospinal tracts and cerebellar dentate nuclei • Cerebral-cerebellar atrophy |
| Patient 2 | |
| No radiological findings. | No radiological findings. |
| Patient 3 | |
| • Less noticeable hypodensities in periventricular white matter • Atrophy |
• High T2W and T2 FLAIR signals extending from the parieto-occipital periventricular white matter and Rolandic sulcus to the corticospinal tract • Atrophy • Sandwich appearance in dentate nuclei • Thick optic nerves and optic chiasm |
| Patient 4 | |
| No radiological findings. | • High T2W signal extending from the Rolandic sulcus to the brainstem along the corticospinal tract and the posterior limb of the internal capsule |
CT: Computed tomography, MRI: Magnetic resonance imaging, FLAIR: Fluid-attenuated ınversion recovery, T2W: T2-weighted
CONCLUSION
In conclusion, if there is a pathological signal in the CST, KD should be kept in mind in the differential diagnosis.
TEACHING POINTS
Radiological findings in KD develop due to the signal created by pathological myelin.
As a result of the accumulation of galactosylceramide cells in KD, hyperdensities occur in the thalamus, periventricular white matter, and corona radiata on CT. Calcification of cerebral tissue, especially the CST, may be noticeable.
In late-onset KD, hyperintense signal changes secondary to myelin damage are seen in the CSTs, internal capsules, and deep cerebral white matter on MRI T2W images. Subcortical U-fibers are preserved. The most common classical finding is the involvement of the CST, and in addition to rare periventricular cerebral calcifications, KD should be kept in mind in the differential diagnosis.
MCQs
-
Which of the following is not among the cranial CT findings of KD?
Bilateral thalamus hyperdensities
Periventricular white matter hypointensities
Corona radiata hyperdensities
Basal ganglia calficications
Thick optic nerves
Answer Key: b
-
Which of the following is not among the cranial MRI findings of KD?
Diffusion restriction on affected areas
Bilateral posterior periventricular white matter involvement
The corpus callosum involvement
Sandwich appearances in dentate nuclei
Thalamic infarcts
Answer Key: e
-
What is the most common imaging finding on MRI in KD?
Thalamic edema
Basal ganglia calcifications
High signal intensity in the CST on T2W and T2 FLAIR sequences
Cerebral atrophy
Dentate nucleus involvement
Answer Key: d
Ethical approval:
Institutional Review Board approval is not required.
Declaration of patient consent:
The authors certify that they have obtained all appropriate patient consent.
Conflicts of interest:
There are no conflicts of interest.
Use of artificial intelligence (AI)-assisted technology for manuscript preparation:
The authors confirm that there was no use of artificial ıntelligence (AI)-assisted technology for assisting in the writing or editing of the manuscript and no images were manipulated using AI.
Financial support and sponsorship: Nil.
References
- Pathogenesis of leukodystrophy for Krabbe disease: Molecular mechanism and clinical treatment. Brain Dev. 2009;31:485-7.
- [CrossRef] [PubMed] [Google Scholar]
- Intracranial and spinal MR imaging findings associated with Krabbe's disease: Case report. AJNR Am J Neuroradiol. 2001;22:1782-5.
- [Google Scholar]
- The pediatric cerebellum in inherited neurodegenerative disorders: A pattern-recognition approach. Neuroimaging Clin N Am. 2016;26:373-416.
- [CrossRef] [PubMed] [Google Scholar]
- Krabbe disease: Unusual MRI findings. Pediatr Radiol. 2006;36:61-4.
- [CrossRef] [PubMed] [Google Scholar]
- Localized proton MR spectroscopy of the brain in children. J Magn Reson Imaging. 1993;3:719-29.
- [CrossRef] [PubMed] [Google Scholar]
- Magnetic resonance spectroscopy and imaging in neurochemistry: Advances in neurochemistry. Vol 8. New York: Plenum; 1997. p. :329-402.
- [CrossRef] [Google Scholar]
- Revisiting magnetic resonance imaging pattern of Krabbe disease-lessons from an Indian cohort. J Clin Imaging Sci. 2019;9:25.
- [CrossRef] [PubMed] [Google Scholar]
- Specific CT findings in Krabbe disease. AJR Am J Roentgenol. 1984;143:665-70.
- [CrossRef] [PubMed] [Google Scholar]
- Intracranial calcification in early infantile Krabbe disease: Nothing new under the sun. Dev Med Child Neurol. 2012;54:376-9.
- [CrossRef] [PubMed] [Google Scholar]
- Intracranial calcification after cord blood neonatal transplantation for Krabbe disease. Neuropediatrics. 2009;40:189-91.
- [CrossRef] [PubMed] [Google Scholar]


