

Translate this page into:
Adding the fourth dimension to computed tomography neck in the evaluation of parathyroid adenoma

*Corresponding author: Sonu Paul, Department of Radiodiagnosis, Pushpagiri Institute of Medical Sciences and Research Centre, Thiruvalla, Kerala, India. dr.sonupaul.rd@gmail.com
-
Received: ,
Accepted: ,
How to cite this article: Paul S, George M, Zachariah SA, Benjamin G, Mangalanandan S. Adding the fourth dimension to computed tomography neck in the evaluation of parathyroid adenoma. Case Rep Clin Radiol. 2025;3:5-11. doi: 10.25259/CRCR_80_2024
Abstract
Parathyroid adenomas are the most common cause of primary hyperparathyroidism. Various imaging modalities such as ultrasound, nuclear medicine imaging studies, and multiphase computed tomography (also known as “four-dimensional” [4D] CT) are the most often used and highly approved imaging modalities for pre-operative diagnosis and localization of adenomas. Accurate pre-operative imaging is of prime importance to facilitate surgery, which is the definitive management, and 4D CT proves to be advantageous.
Keywords
Primary hyperparathyroidism
Parathyroid adenoma
Four-dimensional computed tomography

INTRODUCTION
Hyperparathyroidism is an endocrine disorder resulting from the overproduction of parathyroid hormone (PTH). The most common cause is a benign parathyroid adenoma, and the treatment of choice is surgical excision, which can achieve cure rates of 95–98%.[1] A solitary adenoma can be accurately localized using pre-operative imaging, which is advantageous for the patient and the surgeon since it enables the removal of the aberrant gland alone through minimally invasive surgery.[2] Among various imaging modalities, four-dimensional computed tomography (4D CT) has been shown to have several advantages, including superior diagnostic performance in most comparative studies.[1]
Herein, we report four cases of parathyroid adenomas that were undiagnosed on previous outside positron emission tomography-CT(PET-CT) and nuclear scintigraphy scans.
CASE SERIES
Case 1
A 58-year-old female patient with complaints of body pain and joint pain, diagnosed with hypercalcemia (serum calcium 11.4 mg/dL), came to our center with a PET-CT report negative for parathyroid adenoma. She underwent a 4D CT neck, which showed a small, well-defined ovoid soft-tissue density lesion (low attenuation on non-contrast phase compared to adjacent thyroid) measuring approximately 6 × 4 × 10 mm (AP × TR × CC) posteromedial to the right lobe of the thyroid gland at C5–C6 level. Lesion exhibited arterial phase hyperenhancement with washout on subsequent delayed phases [Figure 1a-c]. There was no evidence of calcification/fat density within.
Correlative ultrasonography (USG) neck showed a well-defined, homogeneously very hypoechoic nodule measuring 10 × 4 mm posterior to the mid/lower pole region of the right lobe of the thyroid [Figure 1d]. There was no calcification/cystic space within. Few flow signals were present in the lesion. The overlying thyroid gland showed an area of mild asymmetric hypervascularity [Figure 1e]. The lesion was seen to elevate the echogenic posterior capsule of the thyroid gland [Figure 1f].
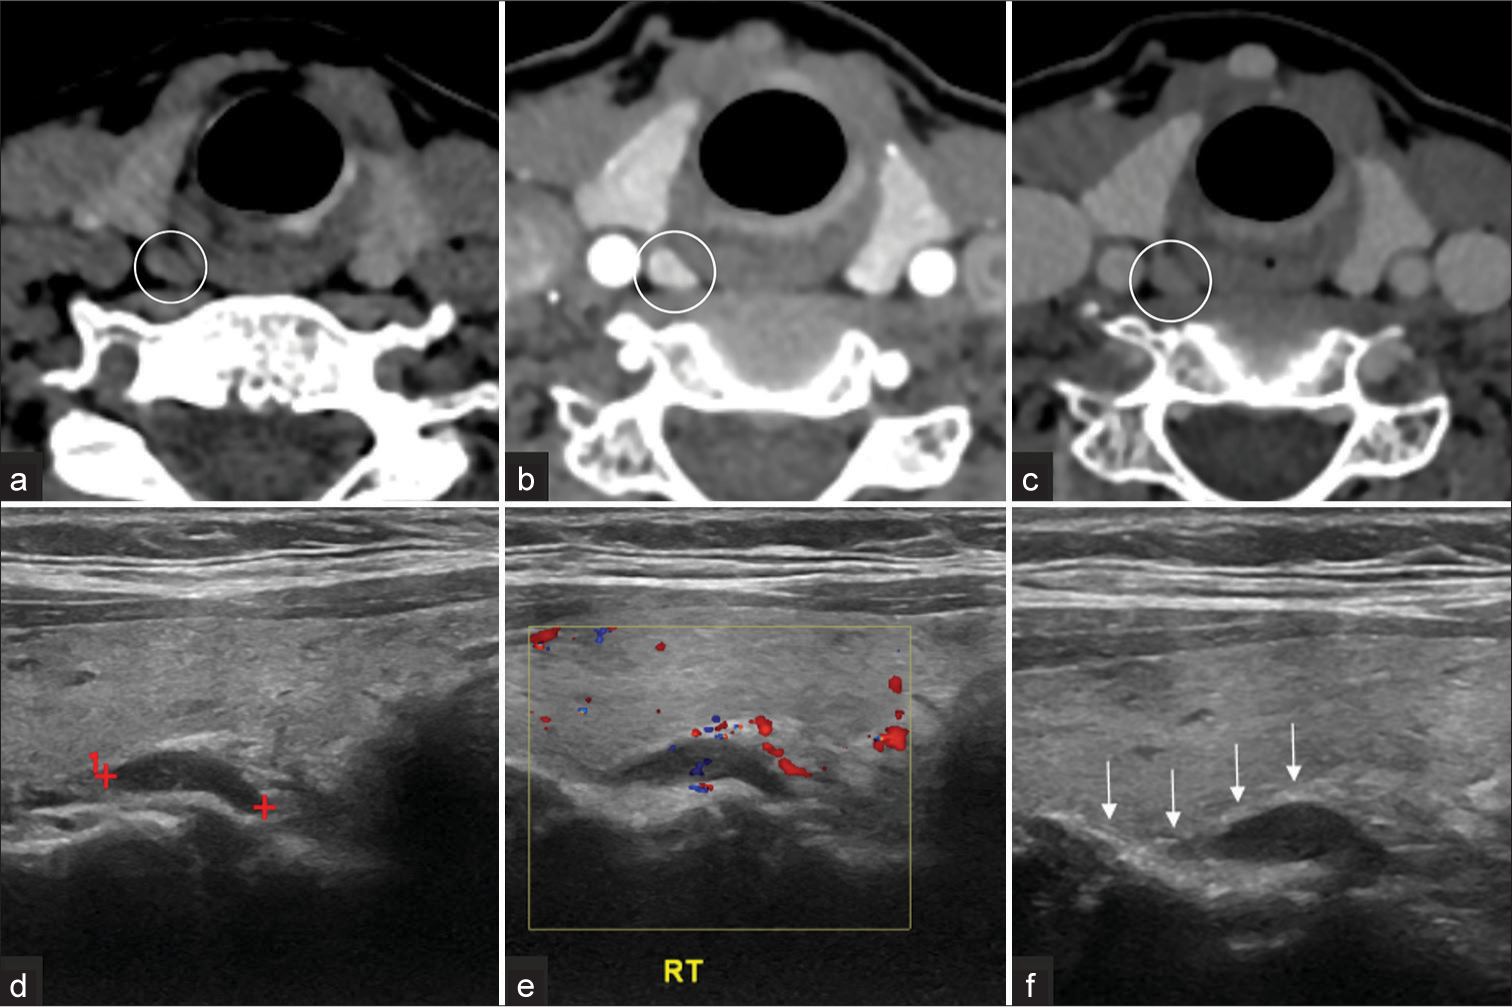
- Classic parathyroid adenoma appearance at Four dimensional computed tomography (4D CT) and Ultrasonography (USG). Axial 4D CT images (a-c) show that the parathyroid adenomas (white circles) are (a) hypoattenuating relative to the thyroid on non-contrast-enhanced images, (b) hyperattenuating on the arterial phase images, and are (c) hypoattenuating (washout) on the venous phase images. This enhancement pattern is also referred to as type A. (d) Grey scale USG shows a well defined, homogenously very hypoechoic nodule posterior mid/lower pole region of the right lobe of the thyroid with (e) few flow signals within. (f) Elevation of the echogenic posterior capsule of the thyroid gland (white arrows) with mild asymmetric hypervascularity. Red cross depicts the measurement calipers, marking the borders of the lesion described in 1d. Yellow box in 1e is the color box used to identify the flow signals. RT: Right side.
Case 2
A 69-year-old female patient with symptomatic hypercalcemia diagnosed with primary hyperparathyroidism (PHPT) (PTH level of 81 pg/mL) came to our center with an outside parathyroid scintigraphy report showing no definite ectopic/primary parathyroid adenoma. She underwent a 4D CT neck, which revealed a well-defined ellipsoid lesion measuring 11 × 5 mm at the inferior and posterior aspect of the right lobe of the thyroid gland, hypoattenuating relative to the thyroid on non-contrast-enhanced images [Figure 2a]. On post-contrast imaging, the lesion exhibited arterial phase hyperenhancement [Figure 2b] compared to the normal thyroid gland, with iso-enhancement in the venous phase [Figure 2c]. No calcification was noted within. An enlarged feeding artery was noted, leading to the end of the lesion.

- (a-c) Axial four-dimensional computed tomography images revealed a Type A parathyroid adenoma (white circles) which demonstrates (a) hypodense arterial phase (b) hyper-enhancing lesion, which is (c) iso-enhancing in the venous phase. (d) USG Neck Grey scale showing a well defined ovoid isomildly hypoechoic nodule. Color and power Doppler images showing internal vascularity in predominant peripheral distribution. (e) The feeding artery (white arrowheads) tends to branch around the periphery of the gland giving the (f) characteristic arc rim of vascularity. Peripheral extrathyroidal feeding arteries seen suggesting a parathyroid lesion over a primary thyroid nodule. USG: Ultrasonography.
Correlative of the USG neck showed a well-defined ovoid iso-mildly hypoechoic nodule caudal to the right thyroid lobe [Figure 2d]. The blood supply by color and power Doppler of the nodule showed internal vascularity in predominant peripheral distribution [Figure 2e]. Peripheral extrathyroidal feeding arteries were seen, suggesting a parathyroid lesion over a primary thyroid nodule. The feeding artery tends to branch around the periphery of the gland giving the characteristic arc rim of vascularity [Figure 2f].
Case 3
A 51-year-old female patient with no significant past medical history was incidentally found to have asymptomatic hypercalcemia with a USG neck and technetium 99m sestamibi (Tc-99m MIBI) parathyroid scintigraphy report showing no evidence of parathyroid adenoma underwent a 4D CT neck. The study revealed a well-defined, smoothly marginated ovoid lesion adjacent to the upper pole of the left thyroid lobe, measuring approximately 14 × 9 × 7 mm (CC × AP × TR). The lesion showed post-contrast enhancement, with relative hypoenhancement to the thyroid gland in all phases [Figure 3a-e]. A small vessel was seen to enter the lesion [Figure 3b,c].

- Four-dimensional computed tomography study shows a parathyroid lesion with type B enhancement characteristics. (a) Non-enhanced phase axial image shows an oval lesion (white circle) posterior to the upper pole of the left thyroid lobe and medial to the left common carotid artery. The mass has low attenuation. (b and c) The arterial phase axial image reveals the lesion (white circles) is vividly enhancing (however, less than the adjacent thyroid gland) and a polar vessel (white arrows) leading to a parathyroid adenoma. (d and e) Venous and delayed phase axial images show washout of contrast material with decreasing attenuation (white circles) compared with the arterial phase.
Case 4
A 32-year-old female patient who was detected to have hypercalcemia on routine checkup and later diagnosed with PHPT (PTH of 95 U/mL), with image negative results on Tc-99m MIBI study done elsewhere, came to our center for a 4D CT neck. The study showed a small, well-defined ovoid soft-tissue density lesion (low attenuation on non-contrast phase compared to adjacent thyroid) measuring approximately 5.7 × 5.6 × 10 mm (AP × TR × CC) noted posteromedial to the left lobe of the thyroid gland at C6 level [Figure 4a]. Lesion exhibited iso-mild hypoenhancement on the arterial phase with washout in subsequent venous and delayed phases [Figure 4b-d]. No evidence of calcification/fat density was seen within.

- Parathyroid adenoma on Four-dimensional computed tomography in a 32-year-old female with hypercalcemia: (a) small, well-defined ovoid hypodense lesion (white circle) posteromedial to the left lobe of the thyroid gland. (b-d) Axial arterial phase images of lesion showing (b) iso-mild hypoenhancement with (c) washout in subsequent venous and (d) delayed phases (depicted in white circles on each image).
Figure 5 depicts the graphical representation of the enhancement patterns of these 4 cases. Based on the clinical history, laboratory results, and imaging findings, the diagnosis of parathyroid adenoma was made. Coronal reformatted 3D reconstruction image of parathyroid adenoma [Figure 6].

- Time (phase)-density curve. CT: Computed tomography, HU: Hounsfield units.

- Coronal reformatted image in the arterial phase demonstrating oval lesion (black arrow) that is separate from the thyroid gland, medial to the right internal jugular vein consistent with type A parathyroid adenoma described in case 2.
All four patients underwent excision surgery under general anesthesia.
Histopathologic examination of the surgically excised specimens confirmed the diagnosis of parathyroid adenoma [Figure 7a-b].

- Histopathology images of the surgically excised parathyroid adenoma specimen (a) Low power field and (b) High power field images showing fairly encapsulated neoplasm of cells arranged in lobules and nests separated by thin fibrovascular septa. Individual neoplastic cells are polygonal with moderate clear to pale eosinophilic cytoplasm, round centrally placed nuclei showing fine dispersed chromatin. Few cells with moderate eosinophilic cytoplasm and round-to-oval hyperchromatic nuclei (oxyphil cells) were noted in between the neoplastic cells.
DISCUSSION
PHPT is an intrinsic parathyroid gland abnormality that produces excessive PTH.[3] It is the most common cause of hypercalcemia and the third most common endocrine disorder. Increasing age and female gender are considered to be of increased risk. The disorder is most commonly associated with a single hyperfunctioning parathyroid adenoma (85–90%) but may also be associated with multiglandular hyperplasia (approximately 6%), double adenoma (approximately 4%), and parathyroid carcinoma (<1%).[4]
The majority of parathyroid adenomas are juxtathyroid and located immediately posterior or inferior to the thyroid gland. Superior gland parathyroid adenomas may lie posteriorly in the tracheoesophageal groove, paraesophageal location, or even as inferior as the mediastinum.[5]
Up to 5% of parathyroid adenomas can occur in ectopic locations. Common ectopic locations include mediastinum, retropharyngeal, carotid sheath, and intrathyroidal regions.[5,6]
Various centers follow their own institutional preoperative imaging algorithm for accurate localization of parathyroid adenomas. The usual sequence is ultrasound as the first-line modality, followed by Tc-99m MIBI parathyroid scintigraphy and CT when the USG results are indeterminate.[7]
4D CT combines three-dimensional imaging with contrast enhancement over time as the fourth dimension and has been demonstrated to have many superior benefits among other modalities, with the majority of comparison research studies demonstrating its higher diagnostic performance.[8]
A 128-slice GE Healthcare Optima multi-detector CT system was used at our institute to generate 4D CT images. Automatic exposure control was used (150—500 mA) at 120 kV. Craniocaudal coverage was from the external auditory meatus to 2 cm below carina, with a small field of view, thickness 2.5 mm, 0.6 s rotation scanning time, and pitch factor 0.984:1. An initial unenhanced scan was obtained, followed by intravenous iodinated contrast injection at a rate of 4 mL/s of 75 mL Xenetix (Iobitridol iodine 350 mg/mL) or ULTRAVIST (Iopromide 370 mg/mL), followed by a 25 mL saline chaser. Scanning was then repeated with the bolus tracking method at approximately around 30, 60, and 90 s. The 0.625 mm thick contiguous reconstructed axial images in all three phases were sent to the picture archiving and communication system for interpretation and to allow manipulation of images on a three-dimensional workstation.
Parathyroid adenomas are generally lower in attenuation than the normal (iodine-containing) thyroid gland on non-contrast images. On contrast-enhanced images, three specific enhancement patterns relative to the thyroid gland have been described. Bahl et al. explain Type A lesions (20%) exhibiting avid arterial hyperenhancement, greater attenuation than thyroid in the arterial phase. Type B lesions (57%) showed rapid venous washout and were lower in attenuation than the thyroid in the delayed phase. Type C lesions (22%) have lower attenuation than the thyroid on non-contrast CT and are neither higher in attenuation than the thyroid in the arterial phase nor lower in attenuation than the thyroid in the delayed phase. Additional imaging features of parathyroid adenomas include calcification, cystic areas, internal hemorrhage, and fat components.[9]
Retrospective studies by Randall et al. revealed that 92.7% of adenomas demonstrating hyperenhancement and iso-enhancement in 7.3%. None of the adenomas were non-enhancing. Arterial phase hyperenhancement is a characteristic feature of parathyroid adenomas, which helps to effectively differentiate them from lymph nodes, which do not show hyperenhancement and are most often iso-enhancing relative to adjacent muscle.[7]
DIFFERENTIAL DIAGNOSIS
The main differential diagnosis for parathyroid adenomas include parathyroid hyperplasia, parathyroid carcinoma, exophytic thyroid nodules and lymphnodes [Table 1].
| Modality | Features | Parathyroid adenoma | Parathyroid hyperplasia | Parathyroid carcinoma | Thyroid nodule | Lymph node |
|---|---|---|---|---|---|---|
| USG | Morphology | Small, well-circumscribed, ovoid | Small, well-circumscribed, ovoid | Large, irregular shaped, lobulated | Well circumscribed | Well-circumscribed, ovoid |
| Echogenicity | Homogenous markedly hypoechoic | Homogenous hypoechoic | Heteroechoic | Hypo/iso/hyperechoic | Central echogenic hilum | |
| Calcification | Uncommon | Uncommon | intranodular | common | +/− | |
| Cystic change | Uncommon | Uncommon | +/− | More common | +/− | |
| Vascularity | Peripheral polar vessel sign(+) | + | ++ | – | Hilar/central+ | |
| Local invasion | – | – | ++ | – | – | |
| CT | NCCT | Hypodense (compared to thyroid) | Hypodense | Heterogeneously hypodense | Hyperdense | Hypodense |
| Cleavage plane with thyroid | + | + | Infiltration into adjacent structures | – | + | |
| Arterial | Avid +++ | +++ | Heterogenous ++ | + | – | |
| Venous | Washout | Washout | No washout | Persistent | Progressive enhancement | |
| MRI | Homogenous, low T1 and high T2, High SI on DWI | Homogenous, low T1 and high T2 | Ill-defined, heterogenous | Heterogeneously high on T2 | High SI on DWI | |
| PET CT/Scintigraphy | Uptake | + | + | + | variable | Mild and delayed |
USG: Ultrasonography, CT: Computed tomography, NCCT: Non-contrast computed tomography, PET-CT: Positron emission tomography-computed tomography, MRI: Magnetic resonance imaging, +/- : may or maynot be present, + : present, - : absent, ++ : moderate, +++ : marked, , SI: Signal intensity, DWI: Diffusion weighted imaging
CONCLUSION
These cases give us an insight into the importance and diagnostic superiority of 4D CT neck in patients evaluated for hypercalcemia and PHPT, especially when the USG neck, PET-CT, and scintigraphy studies show negative results.
TEACHING POINTS
4D CT proves to be a more efficient imaging tool with accurate pre-operative localization when compared to other modalities such as USG and nuclear medicine studies.
Most parathyroid adenomas exhibit arterial phase enhancement (ISO/hypo/hyper enhancing relative to the adjacent thyroid gland) with washout in the subsequent delayed phases.
Correlative ultrasound scanning is useful in cases with a high index of suspicion, as parathyroid adenomas exhibit characteristic imaging features that can be correlated with the 4D CT findings.
MCQs
-
Which among the following is not a common ectopic location for parathyroid adenoma?
Retropharyngeal
Mediastinal
Sublingual
Carotid sheath
Intrathyroidal
Answer Key: c
-
What are the classic appearances of parathyroid adenomas on the 4D CT neck?
Arterial phase hyperenhancement
Washout on delayed phases
Hypodense compared to thyroid on plain sequence
All of the above
Answer Key: d
-
What is the characteristic echogenicity of parathyroid adenomas on USG?
Isoechoic
Hypoechoic
Hyperechoic
Anechoic
Answer Key: b
Acknowledgment
We acknowledge Dr. Jency Mathew, consultant oncosurgeon, and Dr. Jessy MM, HOD Department of Pathology, for their valuable contribution toward the clinical and pathological findings, respectively.
Ethical approval
Institutional Review Board approval is not required.
Declaration of patient consent
The authors certify that they have obtained all appropriate patient consent.
Conflicts of interest
There are no conflicts of interest.
Use of artificial intelligence (AI)-assisted technology for manuscript preparation
The authors confirm that there was no use of artificial intelligence (AI)-assisted technology for assisting in the writing or editing of the manuscript, and no images were manipulated using AI.
Financial support and sponsorship
Nil.
References
- Parathyroid 4D CT: What the surgeon wants to know. Radiographics. 2020;40:1383-94.
- [CrossRef] [Google Scholar]
- Multimodality imaging in hyperparathyroidism. Postgrad Med J. 2009;85:597-605.
- [CrossRef] [Google Scholar]
- Preoperative imaging techniques in primary hyperparathyroidism: A review. JAMA Otolaryngol Head Neck Surg. 2018;144:929-37.
- [CrossRef] [Google Scholar]
- How to perform parathyroid 4D CT: Tips and traps for technique and interpretation. Radiology. 2014;270:15-24.
- [CrossRef] [Google Scholar]
- Contrast-enhanced MDCT characteristics of parathyroid adenomas. AJR Am J Roentgenol. 2009;193:W139-43.
- [CrossRef] [Google Scholar]
- Comparison of 4D CT, ultrasonography, and 99mTc Sestamibi SPECT/CT in localizing single-gland primary hyperparathyroidism. Otolaryngol Head Neck Surg. 2015;152:438-43.
- [CrossRef] [Google Scholar]
- Parathyroid adenomas and hyperplasia on four-dimensional CT scans: Three patterns of enhancement relative to the thyroid gland justify a three-phase protocol. Radiology. 2015;277:454-62.
- [CrossRef] [Google Scholar]


